Side_VS_LGTRAJ01
How to use this plot
Make sure you have the required datafields (air_pressure, number_of_wcb_trajectories, number_of_insitu_trajectories, number_of_mix_trajectories)
You can use it as is by appending this code into your mss_wms_settings.py:
from mslib.mswms.mpl_vsec_styles import VS_LagrantoTrajStyle_PL_01
register_vertical_layers = [] if not register_vertical_layers else register_vertical_layers
register_vertical_layers.append((VS_LagrantoTrajStyle_PL_01, [next(iter(data))]))
If you want to modify the plot
Download this
filePut this file into your mss_wms_settings.py directory, e.g. ~/mss
Append this code into your mss_wms_settings.py:
from Side_VS_LGTRAJ01 import VS_LagrantoTrajStyle_PL_01
register_vertical_layers = [] if not register_vertical_layers else register_vertical_layers
register_vertical_layers.append((VS_LagrantoTrajStyle_PL_01, [next(iter(data))]))
Plot Code
"""
This file is part of mss.
:copyright: Copyright 2021 by the mss team, see AUTHORS.
:license: APACHE-2.0, see LICENSE for details.
Licensed under the Apache License, Version 2.0 (the "License");
you may not use this file except in compliance with the License.
You may obtain a copy of the License at
http://www.apache.org/licenses/LICENSE-2.0
Unless required by applicable law or agreed to in writing, software
distributed under the License is distributed on an "AS IS" BASIS,
WITHOUT WARRANTIES OR CONDITIONS OF ANY KIND, either express or implied.
See the License for the specific language governing permissions and
limitations under the License.
"""
import matplotlib
import matplotlib.pyplot as plt
import mpl_toolkits.axes_grid1.inset_locator
from matplotlib import patheffects
import numpy as np
from mslib.mswms.mpl_vsec import AbstractVerticalSectionStyle
from mslib.mswms.utils import Targets, get_style_parameters, get_cbar_label_format, make_cbar_labels_readable
from mslib.utils import thermolib
from mslib.utils.units import convert_to
class VS_LagrantoTrajStyle_PL_01(AbstractVerticalSectionStyle):
"""
Number of Lagranto trajectories per grid box for WCB, MIX, INSITU
trajectories (ML-Cirrus 2014 product).
"""
name = "VS_LGTRAJ01"
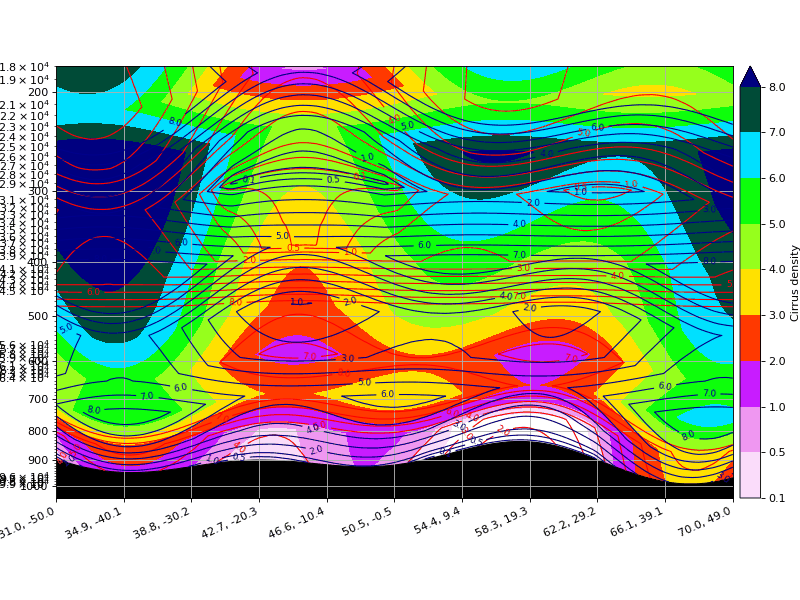
title = "Cirrus density, insitu red, mix blue, wcb colour (1E-6/km^2/hPa) Vertical Section"
abstract = "Cirrus density, insitu red, mix blue, wcb colour (1E-6/km^2/hPa)"
# Variables with the highest number of dimensions first (otherwise
# MFDatasetCommonDims will throw an exception)!
required_datafields = [
("pl", "air_pressure", "Pa"),
("pl", "number_of_wcb_trajectories", 'dimensionless'),
("pl", "number_of_insitu_trajectories", 'dimensionless'),
("pl", "number_of_mix_trajectories", 'dimensionless')
]
def _plot_style(self):
"""Make a horizontal velocity vertical section with temperature/potential
temperature overlay.
"""
ax = self.ax
curtain_p = self.data["air_pressure"]
curtain_wcb = 1.E6 * self.data["number_of_wcb_trajectories"]
curtain_insitu = 1.E6 * self.data["number_of_insitu_trajectories"]
curtain_mix = 1.E6 * self.data["number_of_mix_trajectories"]
thin_contours = [0.1, 0.5, 1., 2., 3., 4., 5., 6., 7., 8.]
# INFO on COLORMAPS:
# http://matplotlib.sourceforge.net/examples/pylab_examples/show_colormaps.html
cs = ax.contourf(self.horizontal_coordinate, curtain_p, curtain_wcb,
thin_contours, cmap=plt.cm.gist_ncar_r, extend="max")
cs_v1 = ax.contour(self.horizontal_coordinate,
curtain_p, curtain_insitu, thin_contours,
colors="red", linestyles="solid", linewidths=1)
ax.clabel(cs_v1, fontsize=8, fmt='%.1f')
cs_v1 = ax.contour(self.horizontal_coordinate,
curtain_p, curtain_mix, thin_contours,
colors="darkblue", linestyles="solid", linewidths=1)
ax.clabel(cs_v1, fontsize=8, fmt='%.1f')
# Pressure decreases with index, i.e. orography is stored at the
# zero-p-index (data field is flipped in mss_plot_driver.py if
# pressure increases with index).
self._latlon_logp_setup(orography=curtain_p[0, :])
self.add_colorbar(cs, "Cirrus density")